 Google Analytics is a great way to examine how well your online store is working. Once you’ve integrated Analytics with your store pages, you can access a huge range of useful reports. Many of these reports can give you a good indication of the success (or otherwise) of your store, and can help you to improve your store and increase sales.
In this article you learn why it’s important to measure your store’s performance, and how to install Google Analytics on your store and start collecting useful data. You then explore some vital metrics for measuring your store’s success, including conversion rate, bounce rate, goal funnels, and more.
Why are analytics and metrics important?
If you’re running any kind of store then you need to know how well your store is doing. You need to know how much of a profit (or loss) you’re making, and you need to know the causes of your profit (or loss).
The great news is that, if your store is online, you can get all this useful data relatively easily. Thanks to Web analytics tools such as Google Analytics, you can measure how well your store is doing and track down specific problems on your store (such as a under-performing product pages).
Using Google Analytics on your store
Setting up Google Analytics is pretty straightforward. Go to the Google Analytics homepage and click the Sign Up Now link. You’ll need to use your Google Account to sign up (if you don’t have one then you can create one at the same time).
Once you’ve signed up, you need to tell Google Analytics about your website. To do this, click the Add Website Profile link on the Analytics Settings page and follow the on-screen instructions.
At the end of this process you’ll be given some JavaScript tracking code. Copy this code and paste it on every page of your site, just before the closing </body> tag. Google Analytics should then start receiving data from your site. After a few hours you can check this by looking for a green tick symbol next to the website profile on the Analytics Settings page.
Once you’ve set up your site in Google Analytics and added the tracking code to your site, you need to tell Analytics to track eCommerce data. To do this:
- On the Analytics Settings page, click the Edit link next to your website.
- On the Profile Settings page that appears, click the Edit link to the right of the “Main Website Profile Information” heading.
- Click the Yes, an E-Commerce Site option, then click Save Changes.
- Add some JavaScript to your receipt page to track transactions. The receipt page is the page that shoppers see after completing a transaction. Many eCommerce systems have features or plugins that can help with adding the JavaScript code. Again, ask your Web developer or software provider if you’re unsure what to do.
Key metrics for measuring success
After you’ve set up your Google Analytics account and have tracked your store activity for a few weeks, you’ll start to have some useful data. What metrics should you be looking at? The following sections explore some important metrics that are worth examining:
- Conversion rate
- Bounce rate
- Pages per visit
- Time on site
- Goal funnels
- AdWords campaigns
Conversion rate
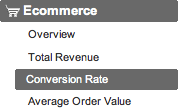
To view conversion rate using Google Analytics, click the Ecommerce menu option followed by the Conversion Rate option:
Conversion rate is arguably the most important metric to measure on your store, because it is a direct indicator of how good your store is at selling your products.
Your store’s conversion rate is the ratio of visitors to sales. For example, if your store gets 1,000 visitors in a day and makes 20 sales, the conversion rate for that day is 20 ÷ 1,000 x 100% = 2%.
Typical conversion rates can vary wildly depending on market segment, but most conversion rates fall somewhere between 0.5% and 5%.
Obviously, if you have a high conversion rate then your store is doing a good job of turning visitors into customers. However, if your conversion rate is low then you’ll need to look at why visitors aren’t buying your products or services.
Even if your conversion rate is relatively high, there’s always something you can tweak on your store that may improve things further. Make a change, then monitor the conversion rate for the next month or so to see if it’s gone up or down.
As well as viewing your overall conversion rate (as shown above), you can view individual conversion rates segmented by traffic source, search keyword, landing page, and so on. For example, click the Traffic Sources menu option followed by the Referring Sites option, then click the Ecommerce tab in the report and view the “Ecommerce Conversion Rate” column. If you have a low conversion rate then these reports can help you pinpoint the problem — for example, it may be that your main traffic source is sending you low-quality visits.
Bounce rate
Useful though conversion rate is, it can take a long time to gather meaningful conversion data, particularly if you don’t have many sales per month. Furthermore, although low conversion rates indicate a problem with your site, it can be hard to locate the exact cause.
For these reasons, it can help to look at other metrics such as bounce rate.
Bounce rate tells you how many visitors leave your site immediately after visiting just one page. If your store’s bounce rate is high then it’s likely that your store is doing a poor job of engaging visitors and turning them into shoppers. If you can reduce your bounce rate then you’ll probably end up increasing your conversion rate as a result.
To find out more about bounce rates and how to measure them with Google Analytics, read:
- What is Bounce Rate?
- How to Measure Your Website’s Bounce Rate
- How to Reduce Your Website’s Bounce Rate
Pages per visit and time on site
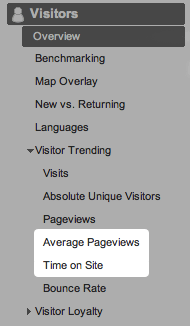
To view the average pages viewed per visit and the average time spent on the site per visit, click the Visitors menu option, then expand the Visitor Trending option and click the Average Pageviews and Time on Site options:
As with bounce rate, these 2 metrics can give you further insight into visitor behaviour on your store. If visitors are only visiting 1 or 2 pages on average, or are spending a very short amount of time on your store, then there may be a problem with your store.
Common causes of a low number of pages per visit with online stores include:
- No obvious “call to action” on landing pages
- Unclear site navigation
- Misleading page titles or product descriptions
Common causes of a low average visit time include:
- Unprofessional or inappropriate site design
- Misleading page titles or product descriptions
- Product range is too small
Goal funnels
Funnels let you see the points where your shoppers are dropping out of the buying process. Say that, for every 1,000 people that visit your product page:
- 100 add the product to their cart
- 80 of those people proceed to the checkout
- 40 of those people complete the checkout form
- 33 of those people confirm their order
From this example, you can see that most shoppers (50%) are abandoning the buying process when they’re asked to complete the checkout form. This would indicate that there are some aspects of the form that are putting people off.
The buying process is often visualised as a funnel. It’s wide at the top (lots of shoppers) and gets narrower as the shoppers “move through the funnel” to the final sale.
Google Analytics lets you set up sales funnels and view how many people are dropping out at each stage of the funnel. To set up a funnel, follow these steps:
- On the Analytics Settings page, click the Edit link next to your website.
- On the Profile Settings page that appears, click the top Add goal link in the “Goals” section.
- On the Goal Settings page that appears, fill in the form, selecting the URL Destination goal type. (More info on creating goals)
- Click Yes, create a funnel for this goal.
- For each step in the funnel process, add the step’s URL (e.g.
/checkout.php) and give the step a name (e.g. “Checkout”). Click Add Goal Funnel Step to add additional steps. - Click Save Goal.
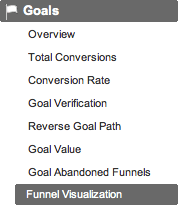
Once you’ve set up your goal and funnel, click the Goals menu option on the reports page, then click Funnel Visualization:
You’ll see a diagram showing each of the stages of your funnel. Each stage shows the number of people who entered that stage. Below each stage, a figure shows how many people proceeded from that stage to the next stage (as a number, and as a percentage).
By looking at this diagram, you can see where most people are dropping out of your funnel, which should give you a good idea as to what parts of the funnel process you should improve.
AdWords campaigns
If you use Google AdWords to drive traffic to your store then it’s a great idea to link your Google Analytics account to your AdWords account. This lets you measure how successful your AdWords campaigns are at generating sales on your site.
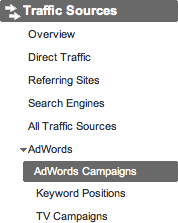
Once you’ve linked your accounts, you’ll see an AdWords option appear under the Traffic Sources menu option. Click the AdWords option to expand it, then click the AdWords Campaigns option to view the campaigns report:
Within the AdWords Campaigns report, you can click the tabs along the top of the report data to see various interesting metrics. Of particular interest is the Clicks tab, which shows you the performance of each AdWords campaign (or ad group) across various metrics. Important metrics that you should look at include:
- Visits
- How many visits the campaign sent to your store.
- Cost
- The total cost of the campaign.
- CPC
- Cost per click: How much each ad click cost you, on average.
- RPC
- Revenue per click: How much each ad click earned you, on average. This is calculated by looking at which clicks resulted in eCommerce transactions and/or goals that have a value assigned to them in Google Analytics.
- ROI
- Return on investment: This is calculated as (total revenue from campaign – total cost of campaign) ÷ total cost of campaign. If this figure is positive then you’re making a profit from your AdWords campaign; otherwise you’re making a loss.
- Margin
- Your profit margin on the AdWords campaign: This is calculated as (total revenue from campaign – total cost of campaign) ÷ total revenue from campaign. Again, you want this figure to be positive, since this shows that your AdWords campaign is profitable.
If you discover from this report that your AdWords campaign has a negative ROI — that is, you’re spending more money on ads than you’re making from them — then you’ll need to look at optimising your ads, keywords, and landing pages.
Other metrics
As well as the key metrics outlined above, Google Analytics gives you many other ways to measure your store’s performance. You might find some of the following reports useful in certain situations:
- Ecommerce > Average Order Value
- The average amount of money that customers spend per order. This can be useful when you’re cross-promoting products or running time-based promotions — if the average order value increases then your promotion is probably a success.
- Ecommerce > Visits to Purchase
- How many times a customer visits your store, on average, before they buy something. This can help you design your store’s structure and content. For example, if customers tend to buy your products on the first visit then your products may be suited to impulse buying — therefore you can design your content to encourage more impulse purchases.
- Ecommerce > Days to Purchase
- How many days, on average, between a customer first visiting your store and buying something. As with the Visits to Purchase report, this information can be useful when it comes to designing and tweaking your store content.
- Content > Site Overlay
- This brings up your site in a new window. For each page of your site, it shows you the percentage of visitors that clicked on each link in the page. It also shows you transactions, revenue and other useful stats for each link. This can be useful for tracking visitor behaviour on your key landing pages, and finding out exactly what actions visitors are taking (or not taking).
The main drawback with Site Overlay is that it groups links in the page by URL. For example, if a page contains 3 links pointing to the same URL then Site Overlay can’t tell you which of the 3 links performed the best. (Here’s a good article discussing Site Overlay’s benefits and drawbacks.)
Summary
In this article you’ve looked at how to use Google Analytics to track your online store’s performance. You’ve seen:
- How metrics can help you improve your store
- How to install and use Google Analytics on your store
- Some important metrics for determining your store’s effectiveness, including conversion rate, bounce rate, pages per visit, time on site, goal funnels, AdWords Campaigns, and more.
You’re now ready to start measuring your metrics and make your store a success. Good luck!
Leave a Reply