Do you sometimes struggle to get useful information from Google Analytics?
You’ve installed Analytics on your site. You know it could give you lots of useful information about your site, your visitors, and your business. But you just don’t know where to begin with it! Its sheer number of reports, options and settings can be overwhelming.
How can you simply use Google Analytics to answer those really important questions about your site? Questions like:
- How popular is my site?
- Are my visitors really interested in my content?
- Which are my most popular pages?
- What are my visitors searching for?
- How do people reach my site?
That’s what this article is all about! In it, you’ll cut through Google Analytics’ forest of submenus, options and reports, and you’ll learn how to use Analytics to answer 11 of the most important questions you can ever ask about your website.
Once you’ve read through the article, you’ll be able to find exactly the stats you need, quickly and confidently. You’ll end up with a ton of useful, actionable data that you can use to improve your site, attract more visitors, and even make more sales.
Sound good? Let’s get started!
How popular is my website?
If you’re like most website owners, probably the first question on your mind is: “How many people visit my site each day?”
The easiest way to find this out is to view the Sessions report. To access this report:
- Open the Audience section in the Google Analytics sidebar.
- Click the Overview link.
The Sessions report tells you how popular your website is. Ideally, this graph goes up over time as your site gets more followers and links from other websites!
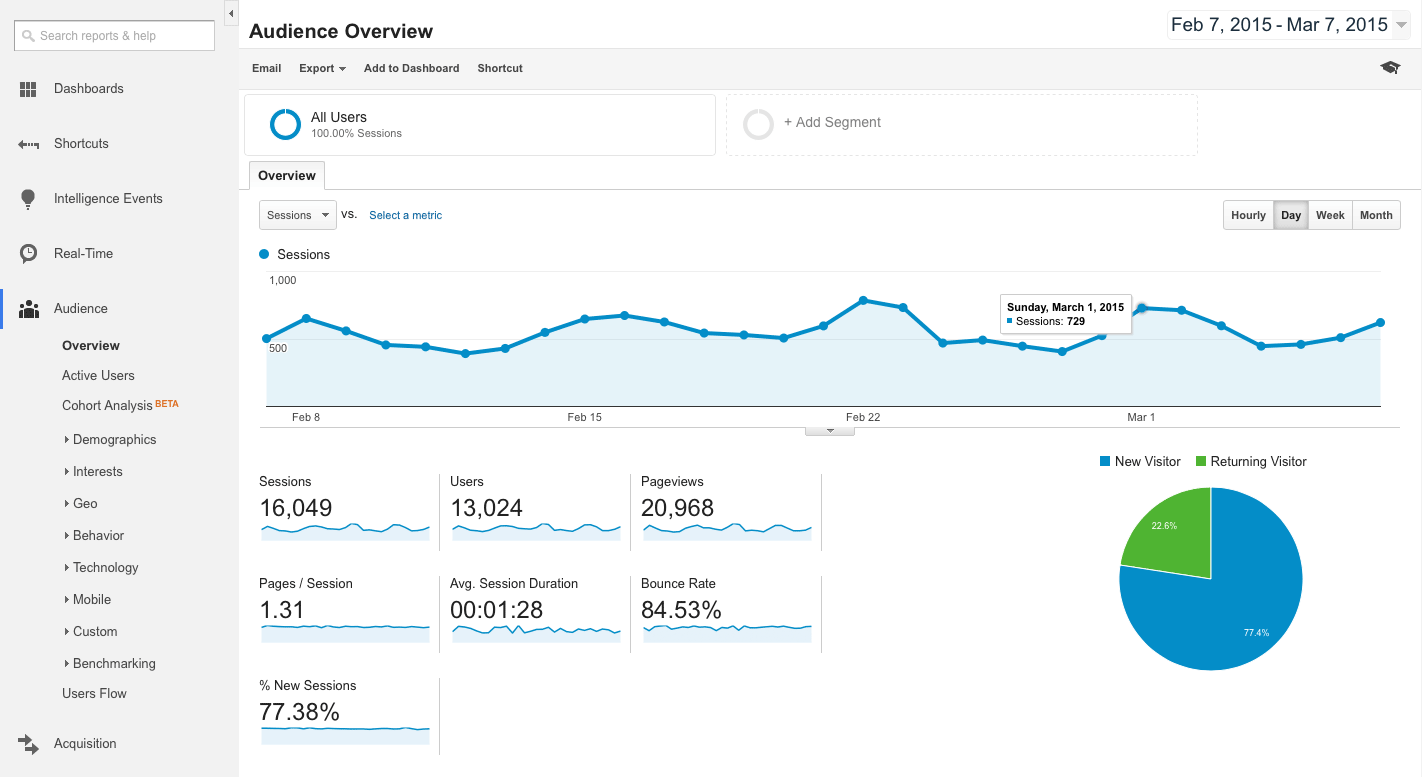
The report shows you the number of sessions, or visits to your site, over a given amount of time. When a person first visits a page on your site, Google Analytics records a new session. If the person then visits other pages on your site within 30 minutes, that’s still counted as part of the same session. However, if they wait longer than 30 minutes before viewing another page, that’s counted as a new session.
How interested are my visitors?
So you know how many visits your site’s getting, but are those visitors actually interested in your site’s content?
The Pages / Session (pages per session) report gives you an indication of how much your visitors are interested in your site as a whole. It shows the average number of pages that people view during each visit.
To access the Pages / Session report:
- Open the Audience section in the Google Analytics sidebar.
- Click the Overview link.
- Click the Sessions drop-down list toward the top of the page and choose Pages / Session.
Most people will follow a link to a page on your site, read the page, and then close the browser tab or use the Back button to return to the previous site they were viewing. This is known as a bounce, and it’s particularly common on blogs, where people tend to read just one article at a time.
However, a certain proportion of readers will think that your website or blog looks interesting, and click a link in your page to visit another page in your site. The higher the Pages / Session figure, the more people were tempted to explore your site deeper, rather than just closing that browser tab.
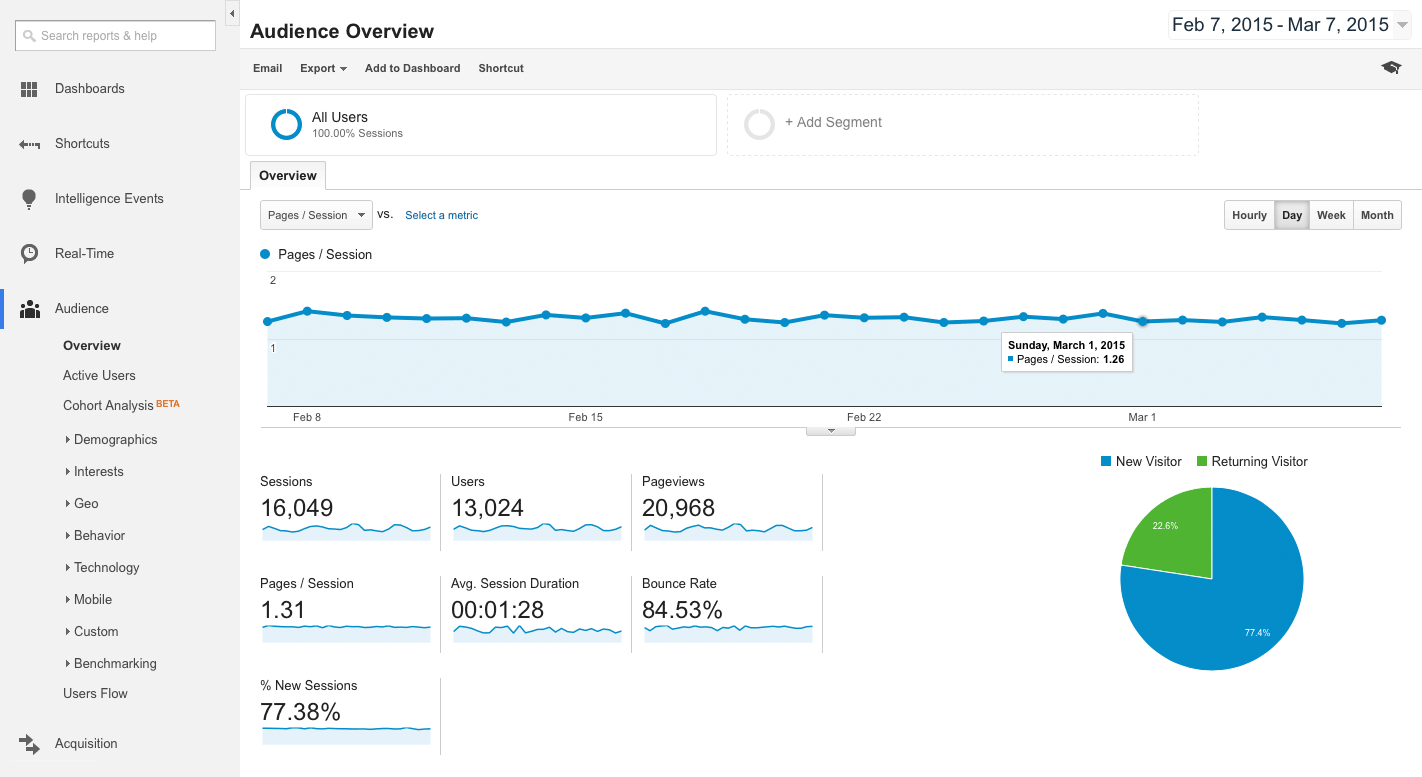
For a typical blog, you can expect Pages / Session to be fairly low — usually somewhere between 1 and 2. For sites where the visitor typically views a lot of pages — such as an online store — you’d expect this figure to be higher than 2.
After you make any change to your page layout — such as adding a “Popular Articles” list to your sidebar — check this report to see what effect it’s had on your visitors.
Which are my most popular pages?
Which content on your site is the most popular? The All Pages report shows you, at a glance, which pages on your site are visited the most.
To access the All Pages report:
- Open the Behavior section in the Google Analytics sidebar.
- Open the Site Content subsection.
- Click the All Pages link.
The table below the timeline graph lists all the pages in your site. For each page, the Pageviews figure shows you how many times that page was viewed over the specified time period.
For example, in the screenshot below, the page with the URL /11-things-to-improve-your-business-today/ was viewed 14,447 times:
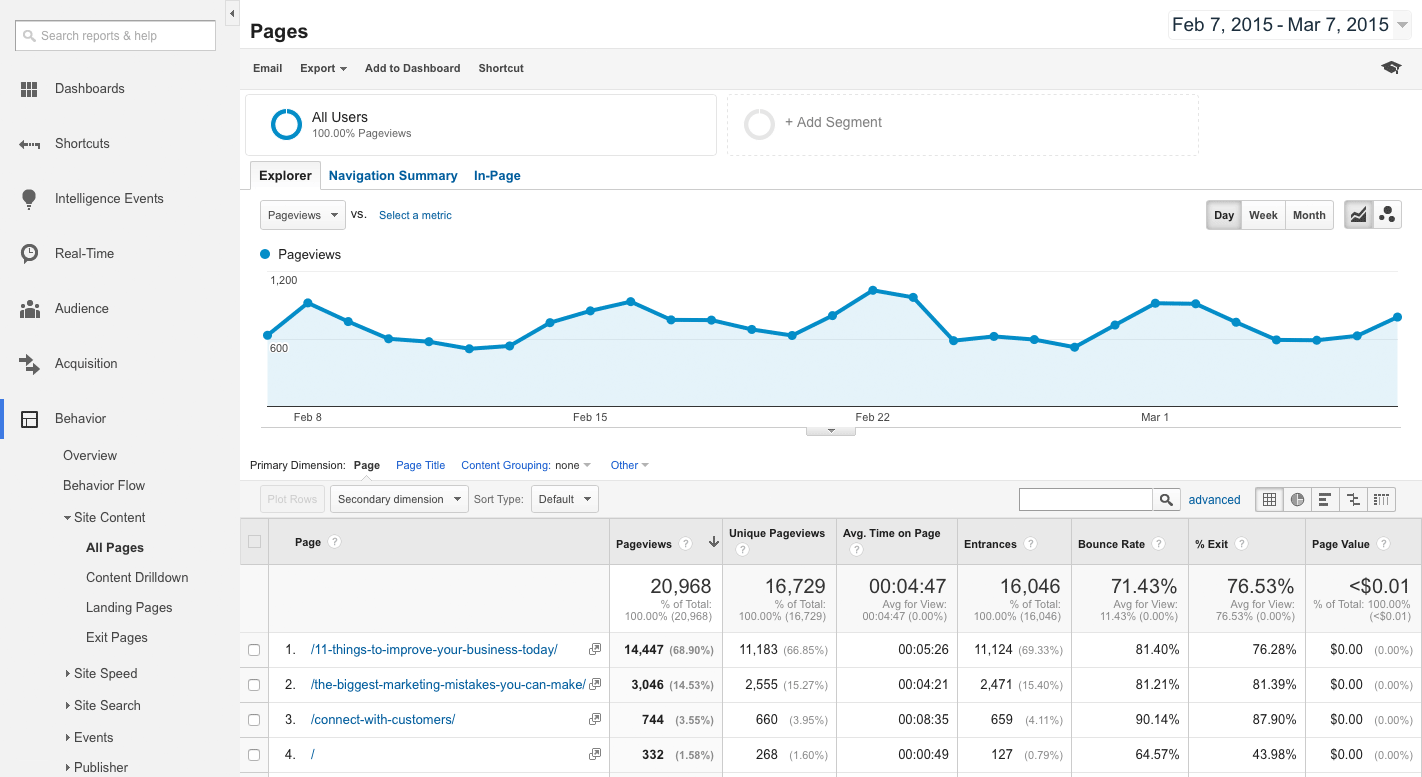
Usually (although not always), the most-visited pages contain the content that most interests your visitors. So it’s worth taking a look at these pages to see what kind of content your readers seem to like. You might then choose to create more of that type of content, or cover those topics in more detail.
How can I examine my stats over different date ranges?
Most reports in Google Analytics show you data over a particular period of time, such as yesterday, the last week, or the last month. You can easily change the time period by clicking the date range in the top right corner of the page. This opens up a date picker, like this:

Here’s how the date picker works:
- To select a range of days, first click the start day in the calendar, then click the end day, as shown in the screenshot below.
- To select a single day, just click on the day in the calendar twice.
- To pick a pre-set date range — such as today, yesterday, last week, or last month — select an option from the Date Range drop-down menu.
- When you’ve selected your date range, click Apply to update the report.

One really nice feature of Google Analytics is the way you can compare two date ranges in any report. This is great for seeing how your site’s traffic changes from, say, one month to the next.
To compare two date ranges, click the Compare to checkbox, then choose an option from the drop-down menu. This defaults to Previous period, which compares it to the period immediately before the date range you selected. You can change it to Previous year to compare the current range with the same range last year, or Custom to select your own date range from the calendar.

How can I access my most important stats quickly in Google Analytics?
You’ve probably experienced that overwhelming feeling where you jump around from one Google Analytics report to another, trying to remember data from the first report while you look at the next. Wouldn’t it be so much more relaxing to have all your important data on one screen?
With dashboards, you can do exactly that. A dashboard holds a customised group of widgets all on one page, so you can see all your important data at a glance. (Widgets are the individual sections, such as timelines and tables, that you see in the reports.)
For example, you could create a dashboard that shows a timeline of your recent visitor sessions, another timeline showing pages per session, and a table that lists your most popular pages.
To create a new dashboard:
- Open the Dashboards section in the Google Analytics sidebar.
- Click the New Dashboard link.
- Click the Blank Canvas button, then type a name for your dashboard.
- Click the Create Dashboard button.
To access your new dashboard at any time, simply:
- Open the Dashboards section in the Google Analytics sidebar.
- Open the Private subsection.
- Click your dashboard’s name inside the Private subsection.
Once you’ve created your blank dashboard, it’s time to start adding widgets to it. There are many ways to add widgets, but the following method is easiest for beginners:
- View the report that contains the widget you’d like to add to your dashboard.
- Click the Add to Dashboard link at the top of the page.
- Select your dashboard from the drop-down menu.
- Click the checkboxes next to the widget(s) that you’d like to add.
- Click the Add to Dashboard button.
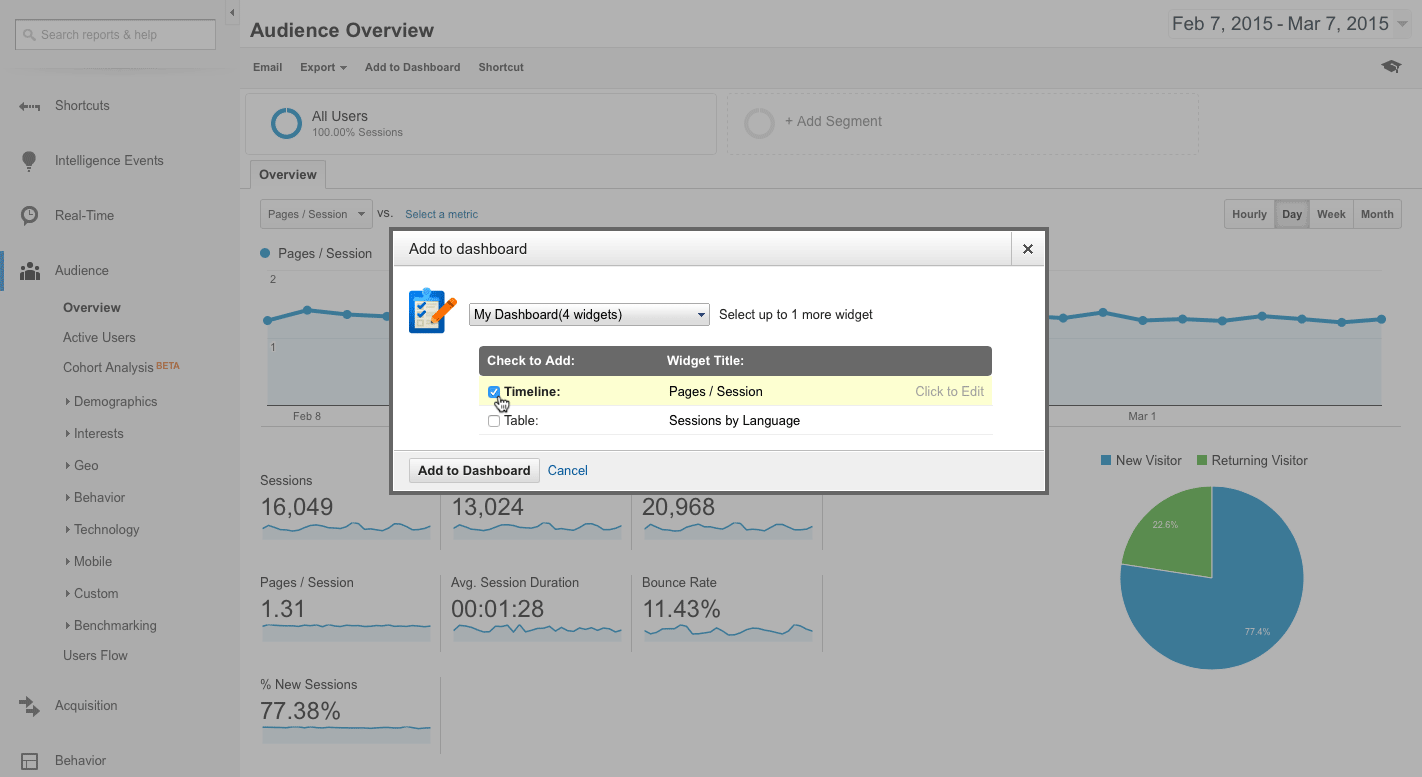
You can also change how the widgets are laid out on the dashboard by clicking the Customise Dashboard link at the top of the dashboard page. (My favourite is the 100% setting, which displays the widgets one below the other.)
How can I find out what’s happening on my site right now?
Most data in Google Analytics takes several hours to update. Normally this isn’t a problem, but if you’ve just started a big ad campaign or social media push then you might want to see what immediate effect it’s having.
To take a peek at the traffic your site’s getting right now:
- Open the Real-Time section in the Google Analytics sidebar.
- Click the Overview link.
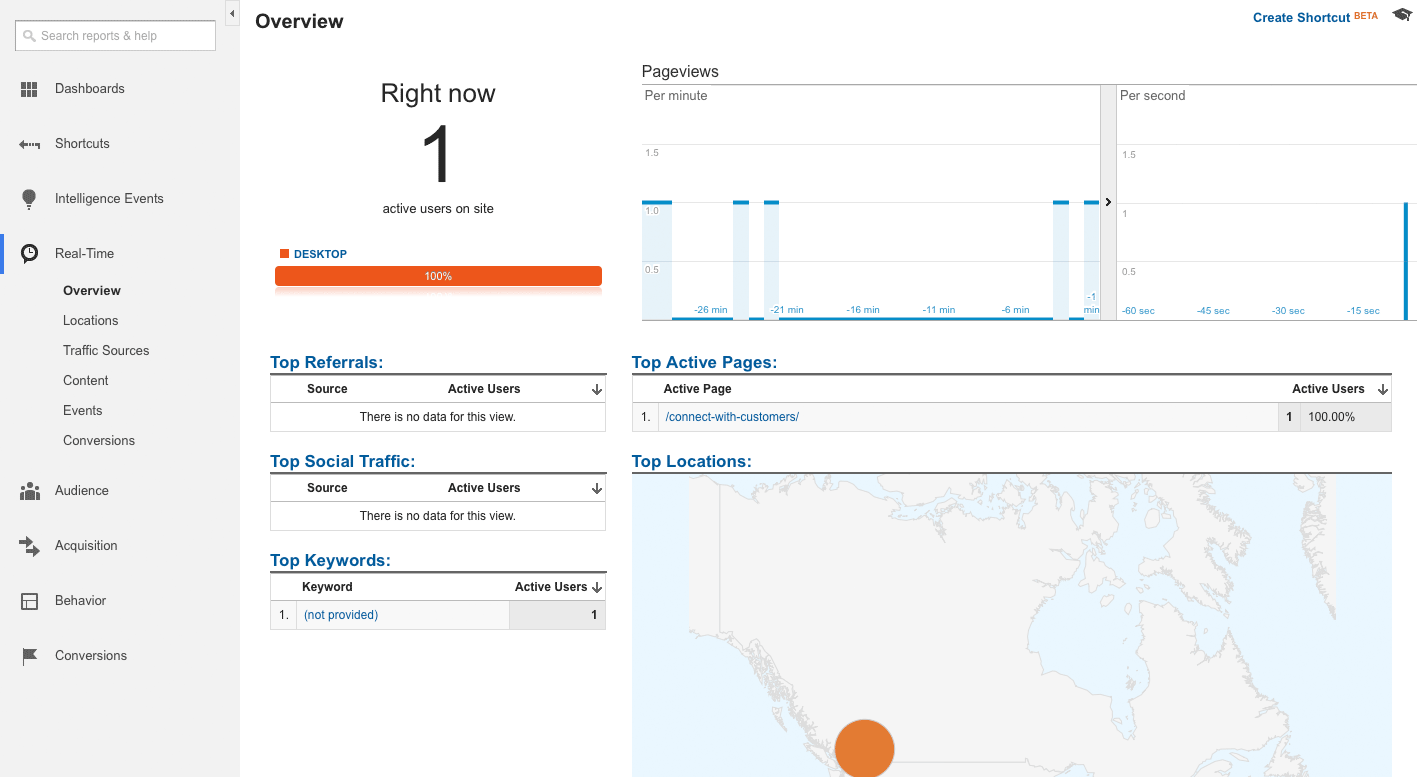
At the top of the page, you’ll see a summary of your traffic at the moment. The big number in the top-left corner shows “active users” — that is, the number of people viewing pages on your site right now. The top-right timeline shows the number of pages viewed in the last 30 minutes or so.
Further down the page, you can see where your current visitors are coming from (Top Referrals), which social media they were using (Top Social Traffic), and which keywords they were searching for to reach your site (Top Keywords). Top Active Pages shows which pages your visitors are viewing at the moment, and Top Locations shows where these visitors are in the world.
How can I see what people are searching for to reach my site?
Most websites get a good chunk of their traffic from search engines such as Google and Bing. Finding out which keywords people search for to reach your site helps you understand the type of audience you’re attracting. It can also give you ideas for future products, services or blog posts that you might like to create.
You can use the Organic Keywords report to see a small selection of the keywords that people use to find your site, as follows:
- Open the Acquisition section in the Google Analytics sidebar.
- Open the Campaigns subsection.
- Click the Organic Keywords link.
The table at the bottom of the page shows you the keyword info. You can see a blue list of keywords in the left-hand column. To the right of each keyword, you can see how many people reached your site with that keyword (under Sessions), as well as other useful info such as the bounce rate per keyword.
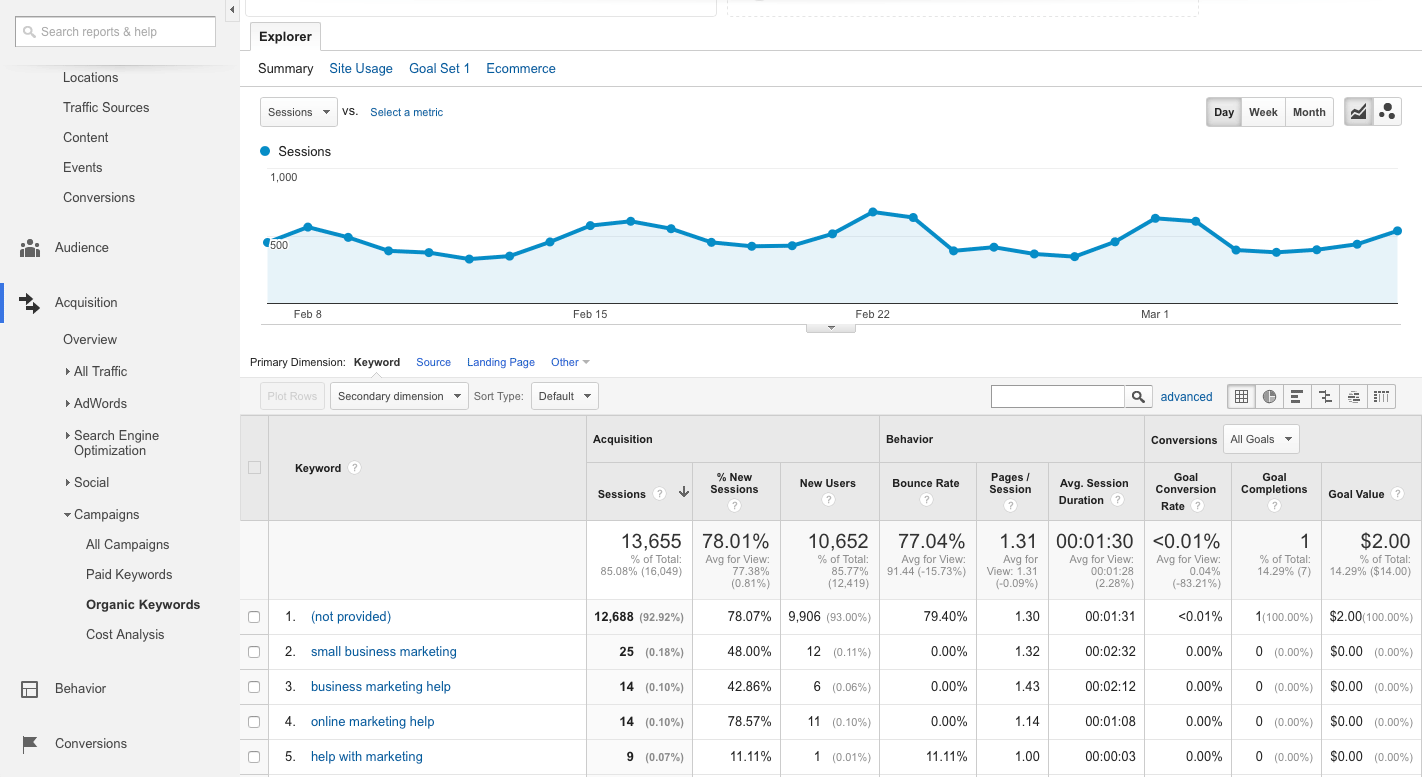
Notice that most of the sessions are tagged as (not provided). That’s because most people search Google while logged into their Google Account, and logged-in searches can’t be tracked directly using Google Analytics. All is not lost, though — there is a way to access most of those keywords too!
The trick is to use another Google tool called Search Console. Follow these steps:
- If you haven’t already done so, add your website to Search Console.
- Click on your website in Search Console to bring up the Dashboard.
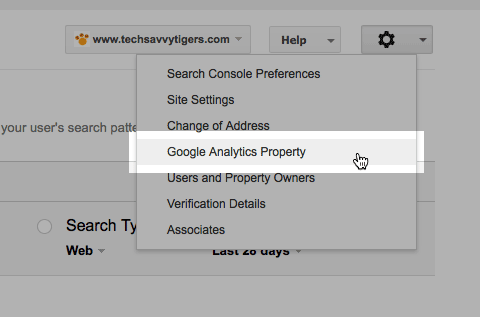
- Click the top-right “gear” button and select Google Analytics Property from the drop-down menu (see screenshot below).
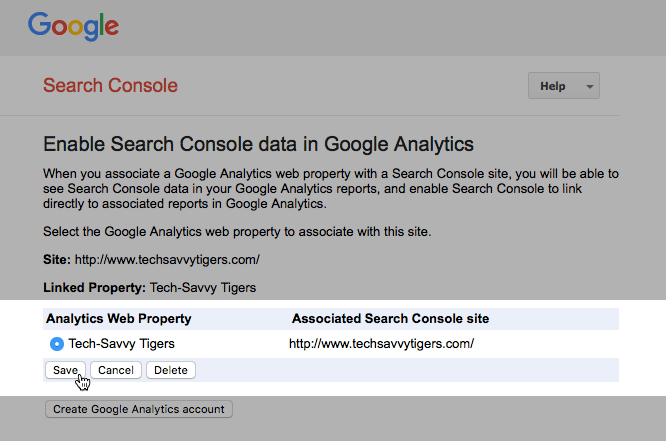
- Provided you’re logged into the same Google Account that you use for Analytics, you’ll see a list of one or more properties appear under the Analytics Web Property column. Click the property that you want to link to your website in Search Console, then click the Save button. Click OK in the Add Association dialog box that appears.
Now reload your Google Analytics page and you’ll have access to a much more comprehensive keywords report:
- Open the Acquisition section in the Google Analytics sidebar.
- Open the Search Engine Optimisation subsection.
- Click the Queries link.
You’ll notice that this has a lot more keywords in than the Organic Keywords report! That’s because they’re pulled straight from the Google search engine via Search Console. For each keyword, you can see how many times your page link appeared in Google search results (Impressions), how many times people clicked through to your page (Clicks), the average position of your link in the search results (Average Position), and the click-through rate (CTR).
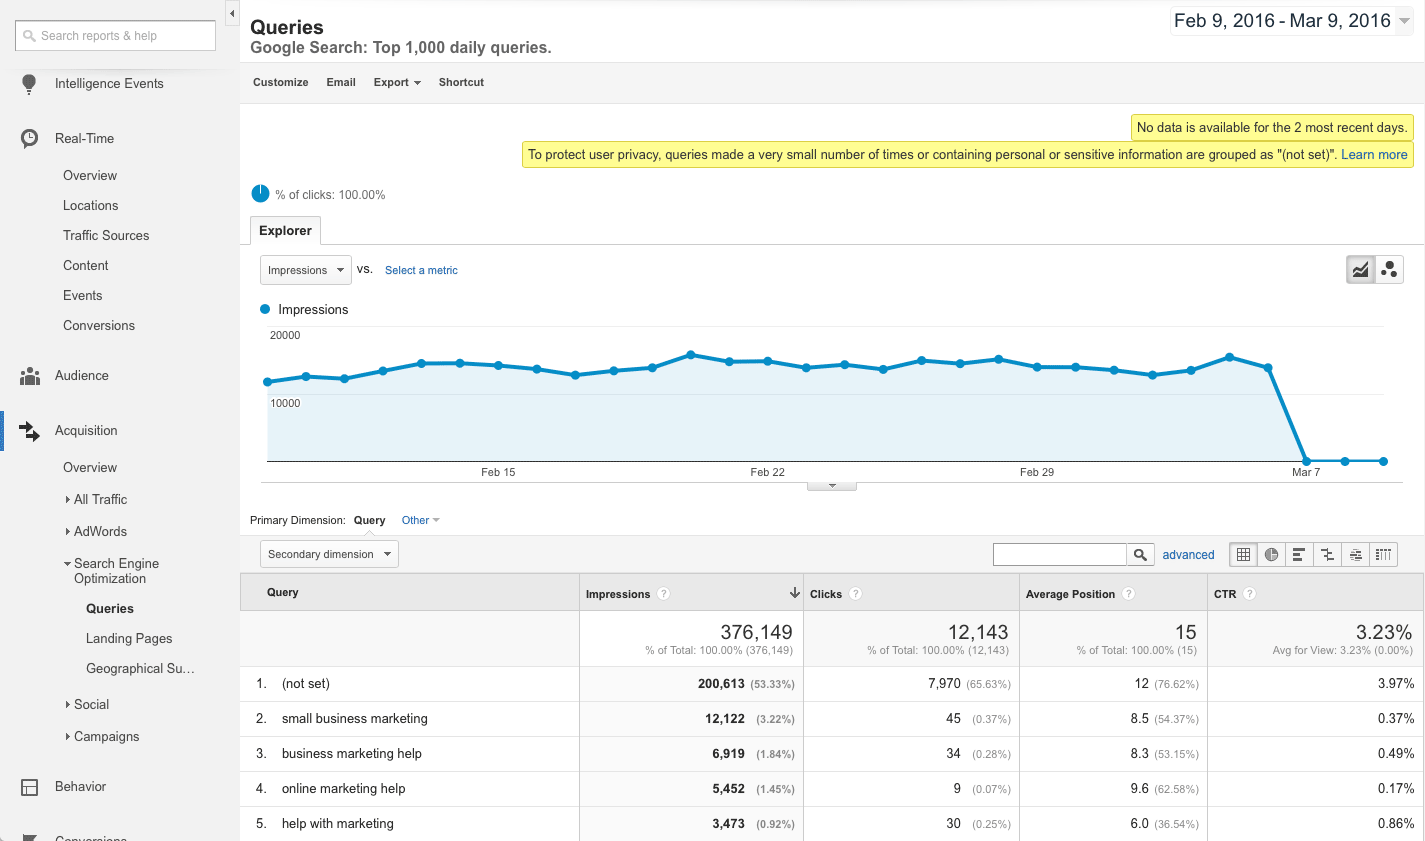
There are two main downsides of the Queries report:
- Infrequently-searched keywords are marked as (not set).
- Only the last 90 days of query data are available.
Despite these drawbacks, the Queries report is worth studying if you want to get a good idea of what your visitors are searching for in Google.
How are people reaching my site?
Knowing where your traffic comes from can be immensely helpful. It can help you decide where to focus your marketing efforts and it can give you insights into the type of audience that enjoys your products, services or content.
To get an overview of your traffic sources, follow these steps:
- Open the Acquisition section in the Google Analytics sidebar.
- Click the Overview link.
You’ll see a pie chart and table showing the main traffic channels, including Organic Search (non-paid searches on search engines), Referral (links from other sites), Social (social media like Facebook and Twitter), and Direct (people clicking links in emails, opening bookmarks, or typing your URL directly into their browsers).
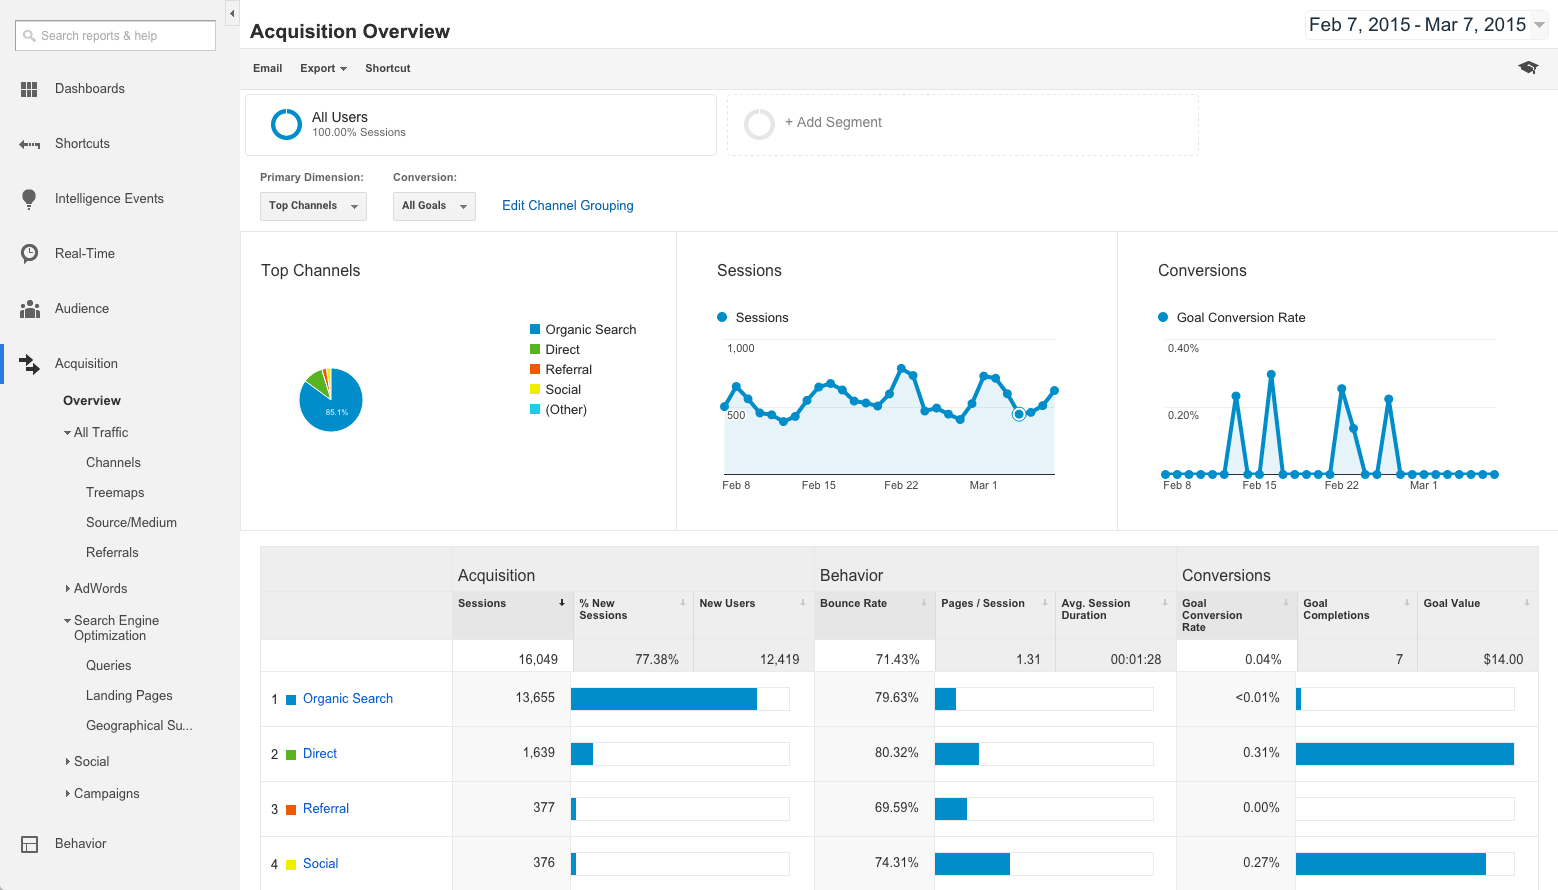
Click one of the channels in the table to reveal more detailed information about that channel. For instance, if you click Organic Search, you’ll see some of the keywords people use to reach your site. If you click Social, you’ll see all the social networks that send you visitors.
If you click Referral, you’ll see the websites that send you traffic. And it gets better! Click on an individual website in the table, and Google Analytics shows you the exact URLs on those sites that are linking to you. You can then click the tiny “arrow” icon to the right of the URL to visit the page and see what they’re saying about you!

How are people reaching a particular page on my site?
If you start to notice that a certain page on your site is getting tons of visits, you probably want to know where that traffic is coming from! Here’s how to do it:
- Open the Behavior section in the Google Analytics sidebar.
- Open the Site Content subsection.
- Click the Landing Pages link.
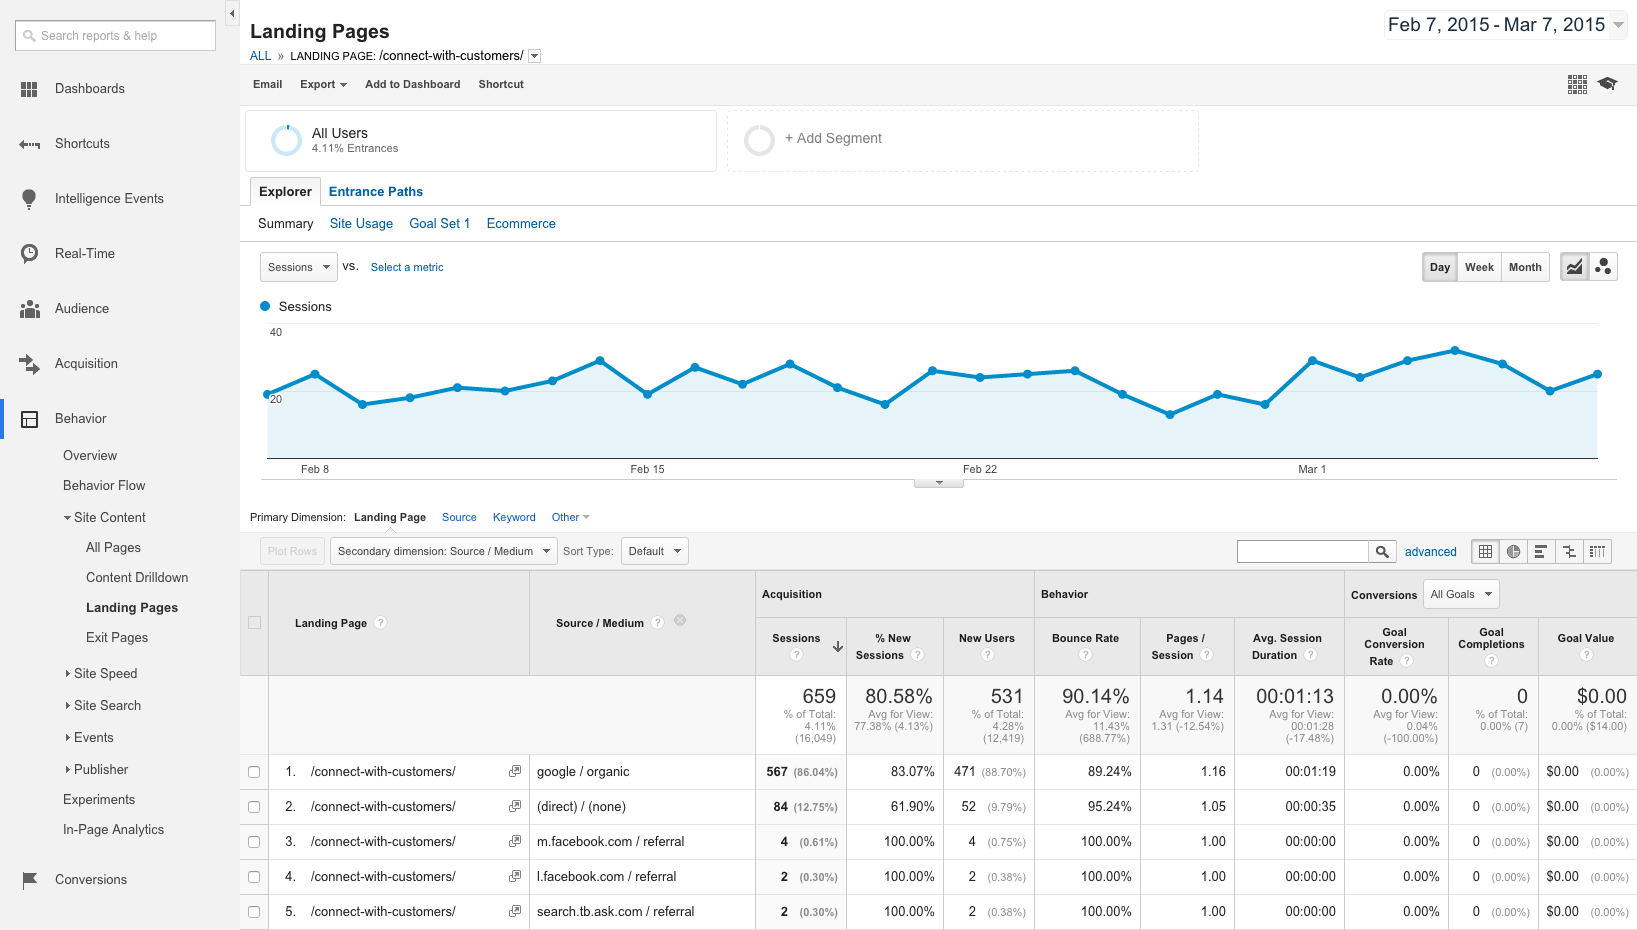
- In the left-hand column of the table, click the URL that you want to investigate. This opens another report that covers just that page.
- Click the Secondary dimension button just above the table.
- In the menu that appears, click Acquisition, then click Source/Medium.
The table now changes to show you all the different ways that people reached that particular page. For example, “google / organic” means those people came from a Google search, while “example.com / referral” means that those people came from a link on the example.com website.
For each traffic source, the Sessions figure shows you how many people came from that source.
How can I discover what my visitors want to know about?
Most of us would love to know what our visitors and customers really want. Knowing your readers’ desires makes it much easier to develop products and content that they’ll love.
Sure, you can conduct surveys and costly market research campaigns. But did you know that you can use Google Analytics to discover what your readers want — using their own words?
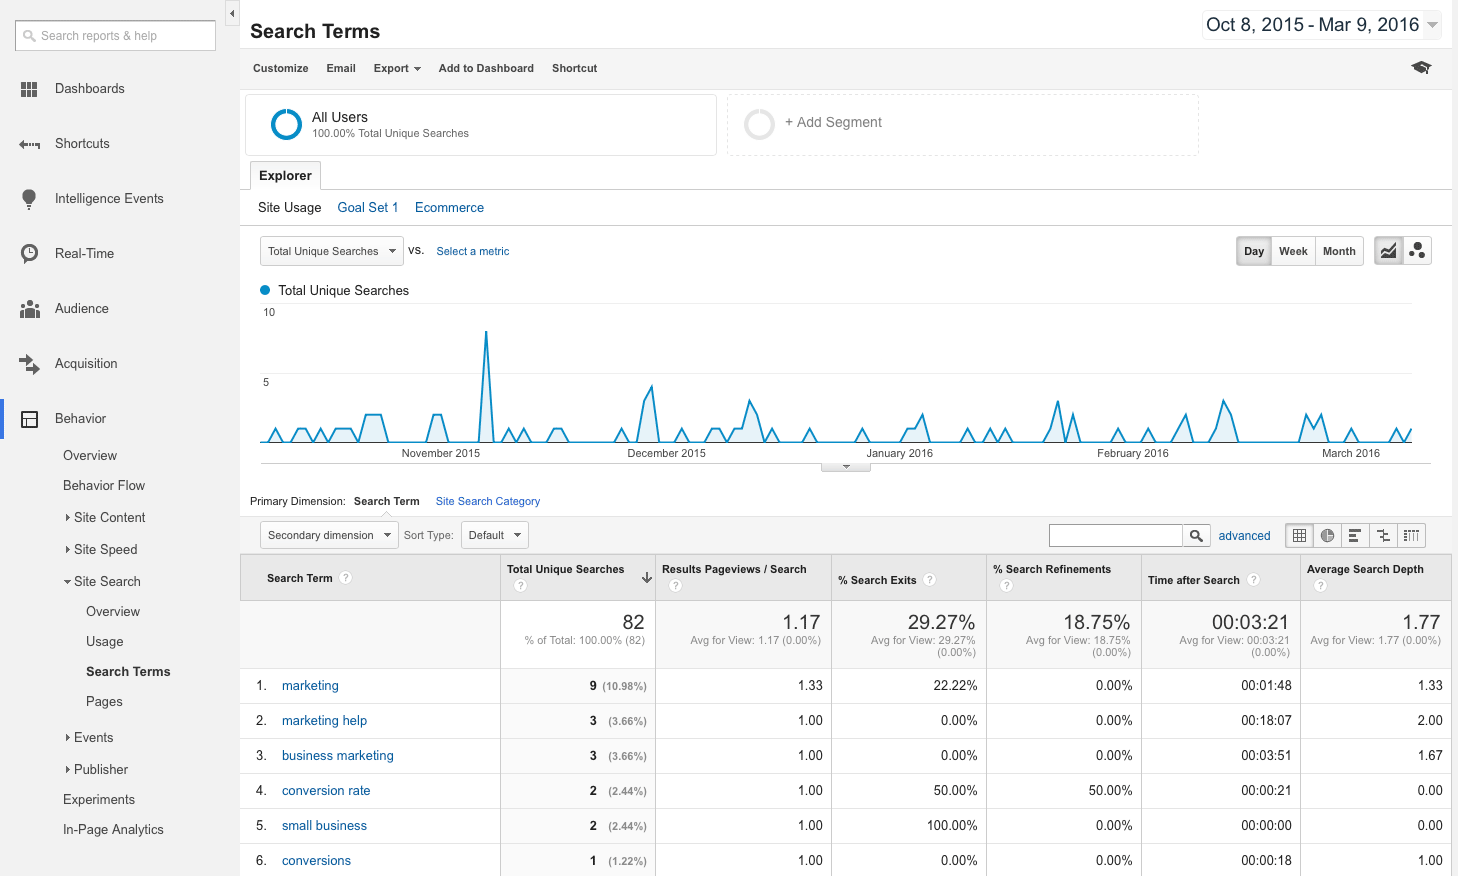
The secret is to link Google Analytics with the search function on your site. (Most content management systems, such as WordPress, have a “search the site” box that appears in the sidebar or footer.) Then, whenever a visitor uses the search box to look for something that they want to learn about, the words they type in will appear in Google Analytics!
Here’s how to do it. The first — and trickiest — thing you need to do is find out your website’s query parameter. This is a special letter or word that appears in the URL in your browser’s address bar when you use the search feature on your site. The easiest way to find this out is to do a search for something like “frogs” on your own site, then click in the address bar and look for the correct chunk of text inside the URL. For example:
http://www.example.com/?searchText=frogs&submit=Search
The bit you want is the chunk of text before “=frogs” and after any other non-word character. In this case, it’s searchText. That’s your query parameter.
Now that you know your site’s query parameter, you can set up Google Analytics to track your site searches. Follow these steps:
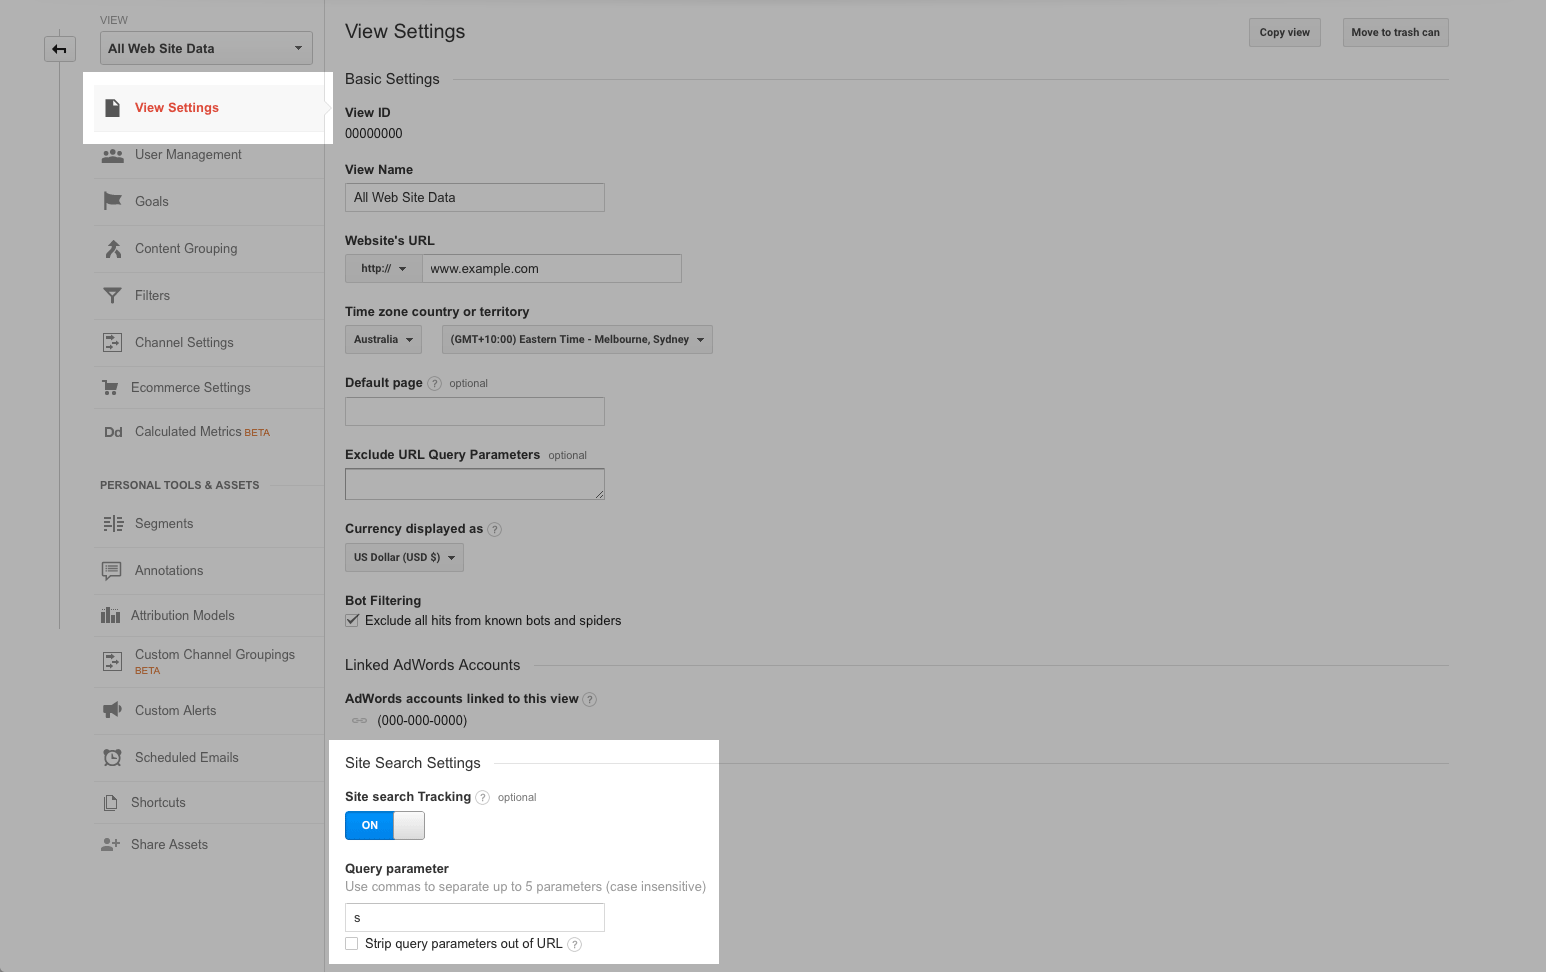
- Click the Admin link at the top of the page.
- Click the View Settings link in the right-hand column.
- Under Site Search Settings, turn on the Site search Tracking switch.
- Below the switch, enter the Query parameter that you worked out earlier.
- Click the Save button.
- Click Reporting in the top menu to return to your reports.
Now wait a few days for people to search your site. You can then view the searches as follows:
- Open the Behavior section in the Google Analytics sidebar.
- Open the Site Search subsection.
- Click the Search Terms link.
You’ll see the number of searches over time in the top timeline, and the actual search text in the table below. Over time, you’ll see which searches are the most popular. Now you know what your site visitors are after!
How can I find out where a traffic spike came from?
Ever opened your Google Analytics to find you got a truckload of traffic a few days ago? Here’s a little trick that quickly shows you where all those lovely visits came from!
First bring up the Channels report:
- Open the Acquisition section in the Google Analytics sidebar.
- Open the All Traffic subsection.
- Click the Channels link.
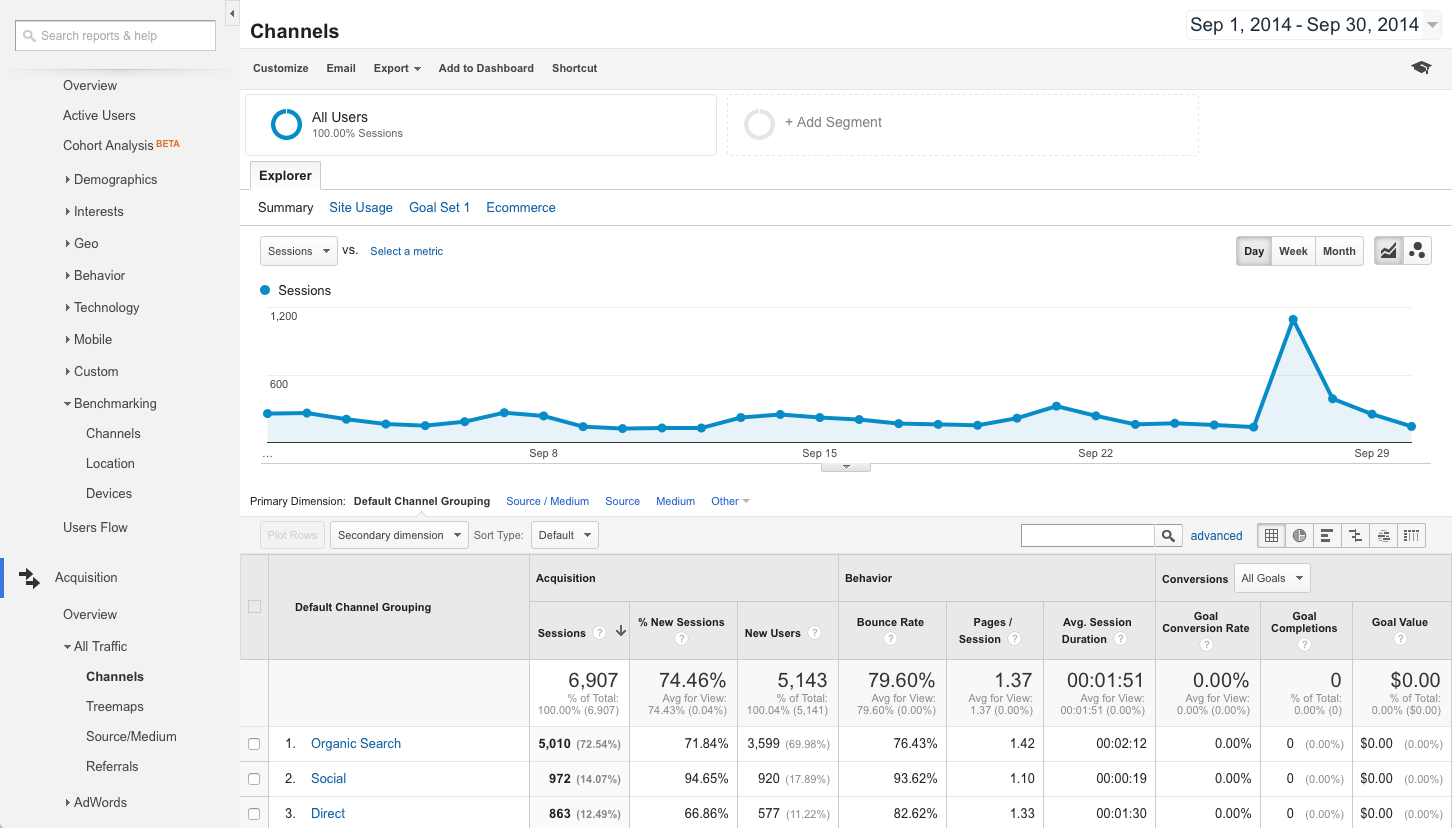
If necessary, adjust the date range so that you can see the spike, with a few days either side. Here’s a traffic spike that one of my sites received back in September 2014:
Now, to find out which type of traffic made up this spike, do the following:
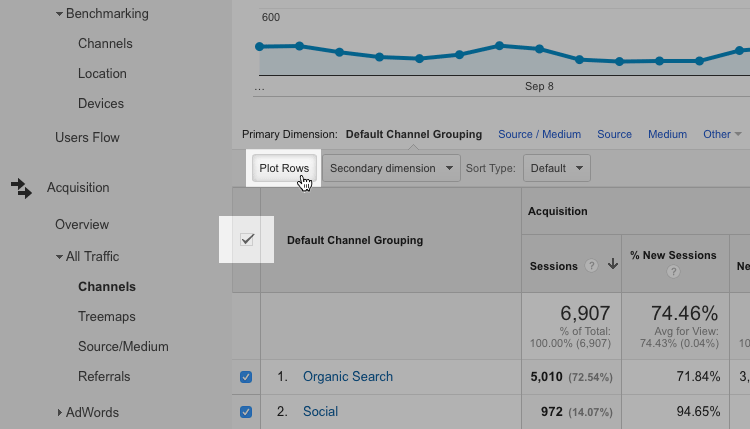
- Click the checkbox on the left side of the dark grey table header (see below). This selects all the channels in the table.
- Click the Plot Rows button above the checkbox:
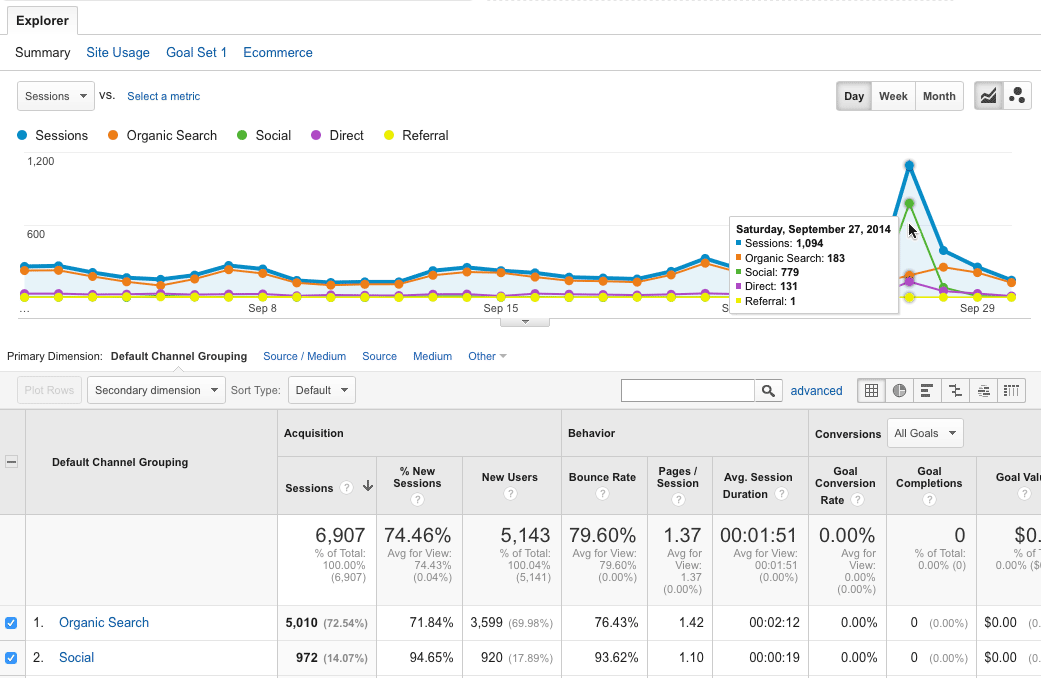
Now, that single timeline graph at the top of the page splits up into several coloured lines. Each line represents the amount of traffic that came through a particular channel.
Hovering over my timeline, I can now see that most of that spike came from the Social channel:
But which social media site was responsible? We can easily drill down to find this out, as follows:
- Click the Social channel link in the bottom table to reveal all the social networks that sent traffic to the site.
- Do the same the process as before: Click the checkbox at the top of the table, then click Plot Rows:
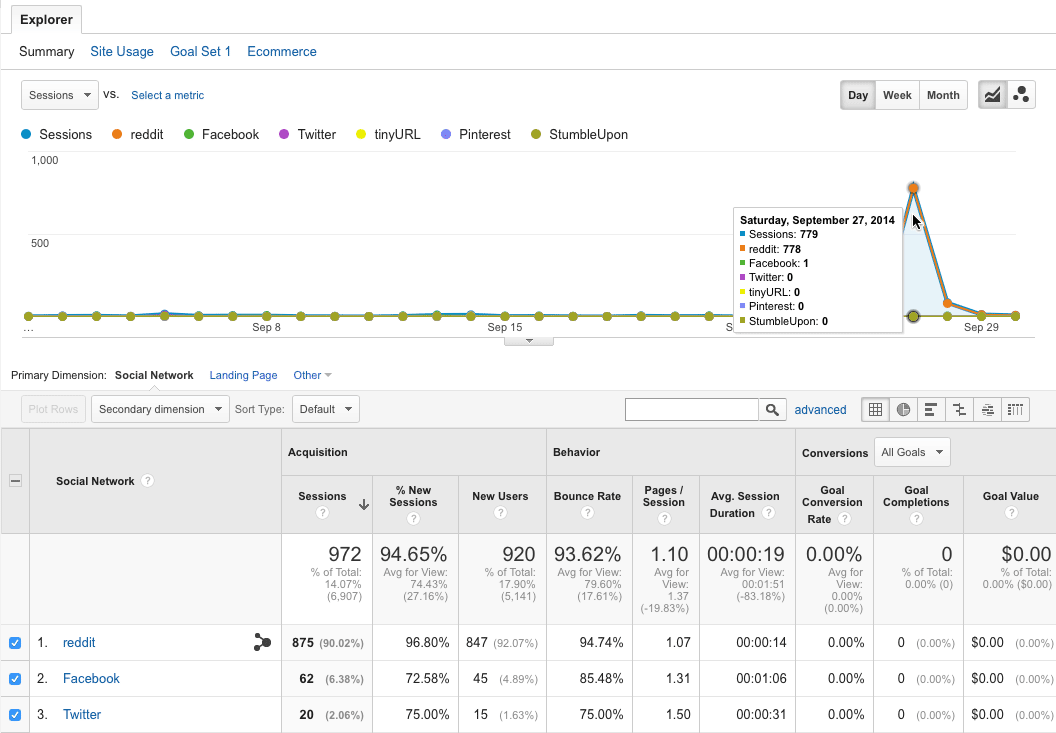
In my case, I can see that the traffic spike came from reddit. But which specific page on my site was shared on reddit? Here’s how to find out:
- Click the reddit link in the table to display just the traffic from reddit.
- Click the Secondary dimension button just above the table.
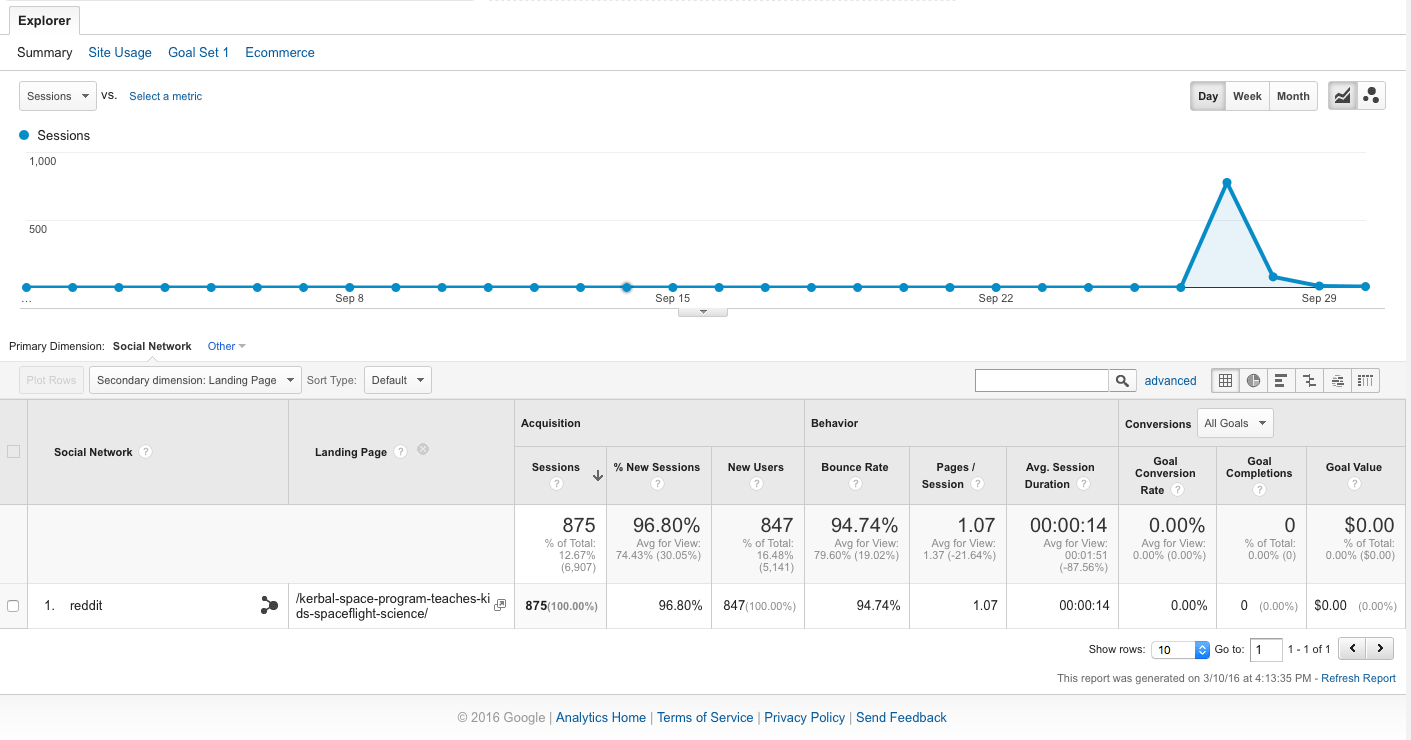
- In the menu that appears, click Behavior, then click Landing Page.
The table now changes to show the exact page that was shared on reddit (in my case it was a blog post on the Kerbal Space Program video game). Useful stuff to know!
Get answers to those burning questions today!
Google Analytics can seem overwhelming at first glance. It’s tempting just to check one report every now and then, or — even worse — ignore your stats completely!
However, if you regularly take just a few minutes each week to check some of the reports listed in this article, you’ll start to get really deep insights into how your website is performing. You’ll understand your audience better; you’ll be able to create products, services and content that they really need; and you’ll discover ways to improve your site and create a nicer experience for your visitors.
So fire up your Analytics today. Pick a couple of ideas from this list, and start delving into your stats. You’ll be amazed at what you discover about your website — and your customers!
[Image credits: 172H by Ryan McGuire (CC0), cropped, edited]

What a brilliant article!
I spent over an our and a half playing about with the sidebar and corresponding reports, which is definitely the most focus I have ever given my metrics!
I now have a dashboard set up and feel happy that I will always be able to check on the things I care about most easily.
Cheers Matt, this was really useful for the neophyte!
Awesome, that’s great to hear Sonya! Thanks for your comment. 🙂
Very useful Matt. I’ll be putting this into practise today.
Thanks for your comment Anita! I’m glad you found the article useful. If you have any questions, please feel free to ask!
Thanks Matt, read your article and was particularly interested in the bit about traffic spikes, so I looked at where a particular spike had occurred and it was paid searches but when I drilled down it said Not Set. I’m using Google Adwords Express at the moment… can you shed any light on that one? Thank you.
Hi Anita,
Hmm… my guess would be that your AdWords and Analytics accounts aren’t linked properly? More info here:
https://support.google.com/analytics/answer/2820717?hl=en
What an amazing amount of free information. I shall be coming back to this later and making full use of it!
Thanks Chinmayi! I’d love to hear what you find out about your website visitors 🙂
This article is just what I’ve been looking for! All of my questions answered, in a way I can understand easily. Thank you so much, Matt & Cat! I am looking forward to re-reading it with Google Analytics open so I can play with it. I’m so happy to finally learn how to use Google Analytics better!
That’s so good to hear Heather! I actually secretly want to do the same myself – I know I could be getting more out of Google Analytics, so I’m very keen to try some of Matt’s fantastic tips on my other websites 🙂
Hey Matt,
Thanks for pouring your brain on this article.
I just sent it to 2 of my blogging students. Coincidentally, We were at the level of hooking up their blogs to GSC and GA so this is a nice resource to ease my work in helping them understand 😉
Thanks for your comment Enstine! I hope your students find the article helpful. 🙂